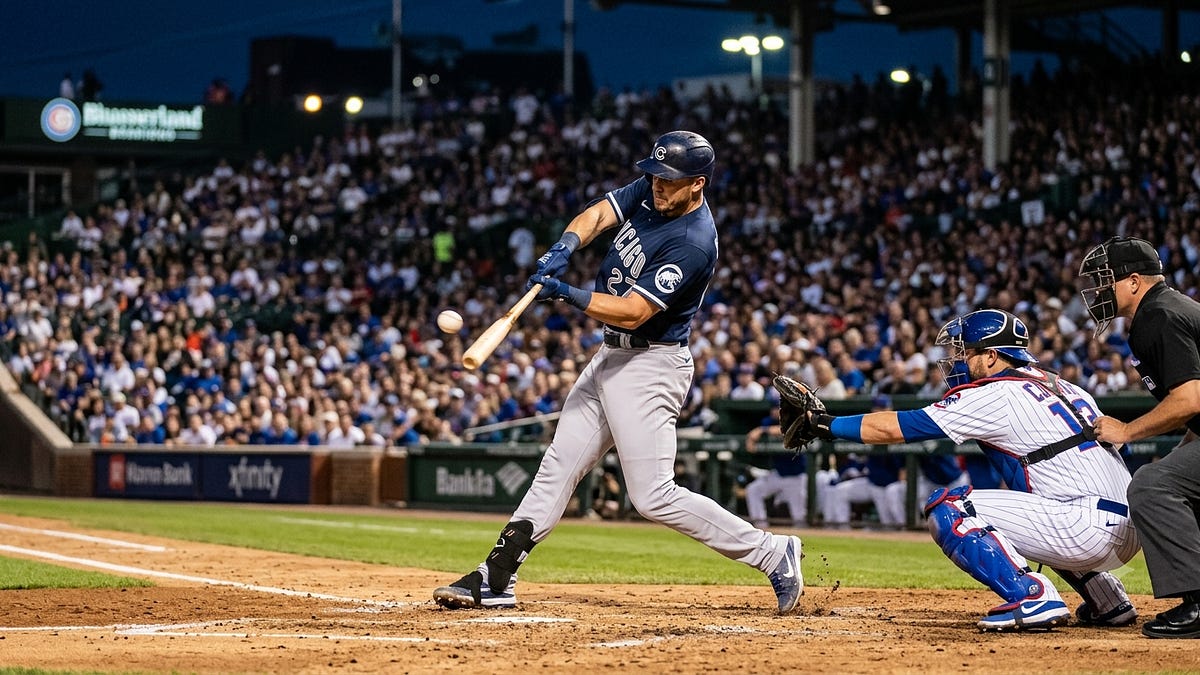
James Wood hits a baseball harder than almost anyone alive. His average exit velocity in 2026 is 95.1 mph — second in all of Major League Baseball, behind only Oneil Cruz. When Wood squares one up, it goes a long way.
He also once swung at a pitch and missed it by 25 inches.
Two feet. The barrel of his bat passed through a piece of airspace that had nothing to do with where the baseball was. In that at-bat, the second-hardest hitter in baseball had roughly the same chance of hitting a home run as you or I did watching from the couch.
That gap — between what a hitter can do and what a specific pitcher lets him do — is the thing home run props are actually pricing. And as of last month, we finally have a number for it.
The logical bridge (and why it’s tighter than it looks)
Let me start by being honest about the obvious objection, because it’s a good one.
Miss distance measures swings that miss. Home runs come from swings that connect. On its face, a whiff-quality metric has nothing to say about home run suppression. A pitcher can generate spectacular misses with his slider and still get his fastball deposited into the seats. The metrics that actually predict home run prevention are the ones we covered before — HR/9, ground-ball rate, exit velocity and barrel rate allowed. Miss distance is not one of them, and anyone selling it as one is overreaching.
But there’s a connection here that’s more than coincidence, and it hinges on one word: barrel.
Recall how home runs actually get made. They require a barrel — the specific combination of exit velocity and launch angle that Statcast flags as the batted ball most likely to leave the yard. Aaron Judge’s monstrous 24.7% barrel rate is why he’s Aaron Judge. No barrel, no home run. It’s close to a physical law.
Now recall how Statcast defines miss distance: the distance between the ball and the barrel half of the bat. Not the whole bat. Not the handle. The barrel specifically — because, as Statcast reasons, contact off the hands isn’t what the hitter is trying to do.
So miss distance is, quite literally, a measurement of how far a pitch stayed from the part of the bat that produces home runs. A pitcher whose slider averages ten inches of separation from the barrel is a pitcher who is systematically denying hitters access to the only tool that hits the ball out.
That’s not proof of home run suppression. It’s a mechanism — and mechanisms are what you want underneath a betting read, rather than a raw correlation you can’t explain.
The names and the numbers
Here’s what the 2026 leaderboard actually looks like, and the names are instructive.
Mason Miller is in his own tier. The Padres closer leads all of baseball in miss distance and, per MLB’s own writeup, is “well ahead of anyone else.” His slider averages a 10.6-inch miss. Read that against the league baseline — the average miss, across all pitches, is three inches. Miller’s out pitch misses barrels by more than three times the league norm. When a hitter swings at it, the bat is, as one writer put it, passing through a different time zone than the ball.
Devin Williams is the deception case. His four-seam fastball generates elite miss distance, which is strange, because scouts generally grade the pitch as good rather than great. The explanation is his changeup — the famous “Airbender” — which dives so late that hitters can’t distinguish the two out of the hand. They guess Airbender, swing where the changeup would be, and the fastball sails over the barrel. The miss-distance data shows it plainly: the top pitchers on this leaderboard generate misses under the ball more than two-thirds of the time. That’s what a hitter defending against a pitch that isn’t coming looks like.
Jacob Misiorowski shows up near the top on fastball miss distance, and would rank even higher on the cumulative 2023-26 board.
And the single largest miss ever recorded belongs to Clayton Kershaw, whose curveball got Ronny Mauricio to swing and miss by 58 inches — just under five feet.
How to actually use this on a home run prop
Here’s the framework I’d use, and note where miss distance sits in it: last.
Step one — establish the hitter’s power the normal way. Exit velocity, barrel rate, and whether his home runs are no-doubt distance or short-porch dependent. Nothing about miss distance changes this analysis. Wood’s 95.1 mph is real whether he’s facing Mason Miller or a Triple-A callup.
Step two — check the pitcher’s actual home run profile. HR/9, ground-ball rate, barrel rate allowed. This is the real HR-suppression data, and it does the heavy lifting. A ground-ball pitcher like Logan Webb (0.63 career HR/9) suppresses home runs for reasons that have nothing to do with whiffs — you can’t hit a grounder over the wall.
Step three — layer the park, weather, and platoon edge. All the factors from the earlier pieces. A righty facing a lefty in a bandbox on a hot day is a different bet than the same righty in Oracle Park in the fog.
Step four — now bring in miss distance, as a tiebreaker. Specifically:
-
Does the pitcher’s primary put-away pitch generate big misses? If a starter’s best pitch is averaging well above the three-inch baseline, hitters aren’t getting the barrel to it. That narrows the paths to a home run in that at-bat.
-
Does the hitter have to face that pitch? This is the matchup question. A slider that misses barrels by ten inches is only relevant if the hitter’s weakness invites the pitcher to throw it. Cross-reference the hitter’s whiff rate by pitch type against the pitcher’s miss distance by pitch type — both are on the Savant leaderboards, filterable by pitch.
-
Is the miss above or below the ball? The directional data matters. A pitch generating misses under the ball (like Williams’s fastball) is beating hitters who are geared for something else. That’s a deception signal, and deception is harder to adjust to mid-game than pure velocity.
The read you’re building toward: “this hitter has real power, but the specific pitch he’ll be beaten with tonight keeps the barrel a foot from the ball.” That’s a No on a home run prop with a mechanism behind it, not a hunch.
The problem with the leaderboard (and it’s a big one)
Now the caveat that reshapes how you use all of this: look at who’s on top.
Mason Miller is a closer. Devin Williams is a reliever. The miss-distance leaderboard is dominated by short-burst, max-effort arms who face three or four batters and throw their best pitch on almost every count. That’s exactly the profile that produces enormous average miss distances — and it’s the profile least relevant to a full-game home run prop.
A player home run prop covers all four or five plate appearances. Your hitter might face the filthy reliever once, in the eighth, if the game state even calls for it. The starter he sees three times is the one who actually determines the prop, and starters — who pace themselves, throw four pitches, and work through a lineup repeatedly — rarely post the eye-popping miss numbers relievers do.
So the honest application is narrower than the headline suggests:
-
For full-game HR props: use the starter’s miss distance, not the league leaderboard’s, and weight it lightly against HR/9 and batted-ball data.
-
For late-inning and in-game markets: this is where the reliever data earns its keep. If the market is live and a hitter is due up against a Mason Miller in the ninth, the miss-distance profile is genuinely informative about how that at-bat is likely to go.
The honest limits
Miss distance only sees misses. It is completely blind to the pitch that got crushed. A pitcher can average huge misses on his slider and still have a fastball hitters are teeing off on — and this metric will never tell you.
The correlation is moderate and the prediction is unproven. Miss distance correlates with whiff rate at roughly .413 (flawed-swing rate does slightly better at .483). That’s a real relationship, not a dominant one. And correlating with whiff rate is not the same as predicting home run suppression — nobody has established that second link, and I’m not going to pretend otherwise.
The data is one month old. It launched in June 2026, with history back to mid-2023. There is no multi-season backtest. Everything above is a reasoned framework, not a validated system.
Whiff-heavy doesn’t mean homer-proof. Some of the nastiest strikeout arms in baseball also give up homers, because the same aggressive, high-spin stuff that misses barrels by a foot gets punished when it catches too much plate. High strikeouts and high HR/9 coexist more often than intuition suggests.
The takeaway
James Wood is the second-hardest hitter in baseball and he once missed a pitch by two feet. Both of those facts are true, and the second one is the whole point: elite power only matters if the barrel gets to the ball.
Miss distance is the first metric that measures exactly that — how far a pitch stays from the part of the bat that produces home runs. Mason Miller’s slider keeps it 10.6 inches away. The league average pitch keeps it three. That difference is real, it’s newly measurable, and it almost certainly isn’t in anyone’s home run prop model yet, because the data has been public for about a month.
Use it the way it deserves to be used: as the last question you ask, not the first. Power metrics and HR/9 do the real work. Park, weather, and platoon shape the edges. And then miss distance answers the final question — can this hitter’s barrel actually get to what he’s going to be thrown tonight?
Sometimes the answer is no by a foot. That’s a bet.
Sourcing: Miss distance and swing timing are Statcast metrics launched publicly in June 2026 on Baseball Savant, with data retroactive to the second half of 2023. Definition (distance in inches between the ball and the barrel half of the bat at closest approach; bunts excluded) and the 3-inch league-average miss are per MLB.com and Baseball Savant. Mason Miller’s 10.6-inch average slider miss distance, his position atop the 2026 leaderboard, the Devin Williams four-seam/Airbender deception effect, Jacob Misiorowski’s fastball ranking, the “misses under the ball more than two-thirds of the time” figure, and Kershaw’s record 58-inch miss to Ronny Mauricio are per MLB.com’s metric explainer and Baseball Savant’s changelog. James Wood’s 95.1 mph average exit velocity (2nd in MLB) is per Baseball Savant’s 2026 top performers; his 25-inch miss is per published reporting on the new metric. Miss-distance-to-whiff-rate correlation (.413; ~.483 for flawed-swing rate) is per FanGraphs analysis. No published research establishes miss distance as a predictor of home run suppression; the framework above is a reasoned application, not a validated model. Verify current leaderboard figures before betting. Nothing here is betting advice.