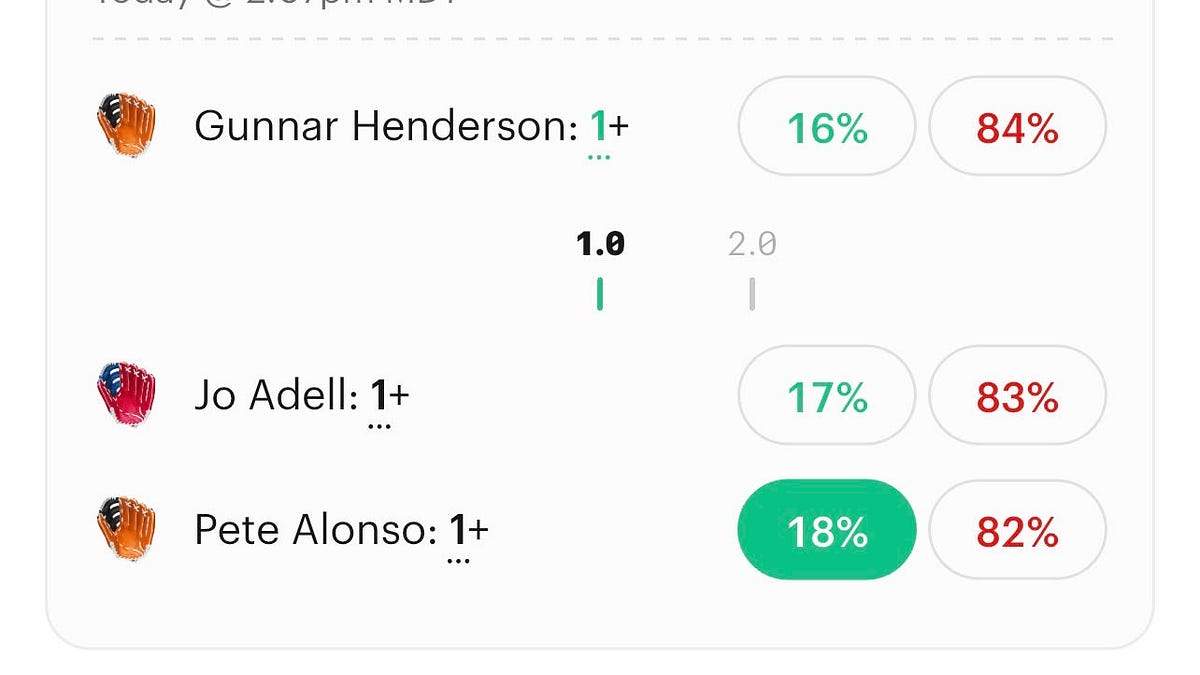
The player home run prop is the lottery ticket of sports betting. “Will Aaron Judge go deep tonight?” pays out big, feels exciting, and gets bet on reputation more than analysis. Most people glance at the name, remember the last bomb they saw the guy hit, and click Yes.
That’s not analysis. That’s a vibe. And the market is happy to sell vibes at a markup.
If you want to actually read a home run prop — to know whether Yes at a given price is a good bet or a donation — you need to look at three things the casual bettor ignores: how hard the hitter actually hits the ball, who’s throwing the pitch, and whether the hitter’s power plays in tonight’s park. Statcast has made all three measurable. Here’s how to use them.
Start with exit velocity, not home run totals
The single most predictive thing about a hitter’s home run ability isn’t how many homers he has — it’s how hard he hits the ball. Exit velocity (the speed of the ball off the bat) is the foundation, because power that shows up in the radar gun every night is far more reliable than a home run count that’s lumpy and luck-dependent.
The 2025–2026 exit velocity leaderboard is a short list of genuinely scary hitters:
-
Oneil Cruz — around 96.0 mph average exit velocity, the hardest hitter in baseball. He also owns the hardest-hit home run of the entire Statcast era: a 122.9 mph blast off Logan Henderson in May 2025.
-
James Wood — around 95.6–96.3 mph, neck-and-neck with Cruz at the top.
-
Aaron Judge — about 95.4 mph average exit velocity with a monstrous 24.7% barrel rate in 2025.
-
Yordan Alvarez, Pete Alonso, Jordan Walker — all clustered in the mid-94s, elite by any standard.
Why does this matter more than the home run count? Because exit velocity is stable. A hitter who averages 95+ mph is going to keep producing the kind of contact that leaves the yard, even through a cold streak in the box score. A hitter sitting at 88 mph who happens to have a few homers is living on park effects and luck — and that’s exactly the profile the market overpays for after a hot week.
Then look at barrel rate — the “damage” stat
Exit velocity tells you how hard. Barrel rate tells you how often a hitter makes the perfect kind of contact — the combination of exit velocity and launch angle that turns into home runs and extra-base hits at the highest rate. A barrel is, essentially, the batted ball most likely to leave the park.
Judge’s ~24.7% barrel rate is the headline number here: nearly a quarter of his batted balls are barreled, which is a cheat code. Cruz pairs his record exit velocity with a strong ~17.9% barrel rate — elite power plus real frequency. The pairing is the point: exit velocity without barrels is a guy who hits the ball hard into the ground; barrels without exit velocity is a guy who lifts it but can’t carry it out. You want both. The hitters with both are the ones genuinely worth a Yes when the rest of the matchup lines up.
“No-doubt” distance: would it be a homer anywhere?
Here’s a concept that separates sharp home run analysis from casual: not all home runs are created equal, and Statcast lets you tell them apart.
A 360-foot fly ball that sneaks over the short porch in Yankee Stadium is a home run in maybe five parks. A 440-foot bomb is a home run in all 30. Statcast tracks how many of the 30 MLB ballparks a given batted ball would have left — and a hitter who consistently produces “no-doubt” distance (balls that go out everywhere) is far more matchup-proof than one whose homers cluster in the 360–380 range and depend on a friendly park.
For context on what real distance looks like: in 2025, dozens of homers traveled 459+ feet, with the longest blasts pushing toward 480–490 feet. The hitters who live up there — the Cruzes, the Judges, the Ohtanis (whose hardest was a 120.0 mph shot) — hit homers that don’t need help. When you’re betting a prop on a true no-doubt power hitter, you’re far less exposed to park and weather than when you’re betting a guy who needs the porch.
The practical read: a no-doubt power hitter is a cleaner Yes in any park. A short-porch-dependent hitter is only a good Yes when the park cooperates — and a trap everywhere else.
Now the other side: who’s pitching?
A home run prop is a matchup, not a solo act. The same hitter is a different bet depending on the arm he’s facing, and the key pitcher stat is HR/9 — home runs allowed per nine innings — driven mostly by whether the pitcher keeps the ball on the ground or in the air.
The stingiest active pitchers make even great power hitters a tough Yes:
-
Logan Webb — about 0.63 HR/9, the best mark among active starters, a pronounced ground-ball pitcher.
-
Max Fried — about 0.72
-
Framber Valdez — about 0.74, another elite ground-ball arm
-
Blake Snell — about 0.86
-
Zack Wheeler — about 0.87
When a hitter faces one of these guys, the “Yes homer” prop gets meaningfully worse, because a ground-ball pitcher is, by trade, denying the hitter the elevated contact a home run requires. You can’t hit a grounder over the wall.
On the other end, fly-ball-prone pitchers and shaky back-end arms can run HR/9 rates north of 1.5–2.0. An elite exit-velocity hitter facing a fly-ball pitcher with a high HR/9 is the single most favorable home run prop setup that exists — the hitter’s power and the pitcher’s vulnerability point the same direction.
The handedness and park overlay
Two final modifiers that decide close calls:
Handedness matchup. A left-handed power hitter against a right-handed fly-ball pitcher, pulling toward a short porch, is a different bet than the same hitter facing a tough lefty. Platoon splits are real and the market doesn’t always fully price them on individual props.
The park. Even a no-doubt hitter gets a boost in a launching pad. Dodger Stadium (~129 HR park factor), Great American Ball Park (~122), and Yankee Stadium (lethal for lefty power) inflate the odds; PNC Park (~66–78, the toughest in 2025), Oracle Park, and T-Mobile/Globe Life (~91) suppress them. And handedness matters here too — Yankee Stadium’s porch is a lefty’s dream and fairly ordinary for righties; Camden Yards became one of the toughest parks for right-handed homers after its wall changes.
The full read, in order
Put it together and a sharp home run prop read goes like this, in priority order:
-
Is the hitter a real power hitter? Check exit velocity (90+ mph average is the baseline; 94+ is elite) and barrel rate, not just his home run count.
-
Does his power travel? No-doubt distance hitters are matchup-proof; short-porch hitters need help.
-
Who’s pitching? A ground-ball ace (Webb, Valdez) tanks the Yes; a fly-ball, high-HR/9 arm supercharges it.
-
Does the handedness matchup favor the hitter? Lefty pull power into a short porch, platoon edge, etc.
-
Does the park (and weather) cooperate? Launching pad and wind out = lean Yes; graveyard and wind in = lean No.
When all five line up — a 95-mph-exit-velo barrel machine, with no-doubt distance, facing a fly-ball pitcher, with the platoon edge, in a bandbox with the wind blowing out — that’s the best Yes you’ll find. When they all point the other way, the slugger everyone wants to bet is a quietly excellent No.
The honest caveats
Home runs are violently high-variance. Even the perfect setup is usually still a minority chance to homer in a single game — the best power hitters go deep in maybe a third of their games at the very most. A “good” home run prop bet is rarely better than a coin flip; it’s about getting a price that’s better than the true probability, not about certainty. Most nights, even the best hitter doesn’t homer. That’s the nature of the bet.
The market prices most of this. Sportsbooks and sharp prediction-market traders already fold exit velocity, matchup, and park into home run prop lines. You’re not finding a secret — you’re avoiding being the person who bet a no-doubt fade into a ground-ball ace at a pitcher’s park because the name looked good. The edge is in the mismatch the casual money misreads, not in the data itself.
Verify the live numbers. Exit velocity, barrel rate, and HR/9 all move through a season; park factors shift with renovations and samples. Every figure here is a recent-window number — pull current data from Baseball Savant (exit velocity, barrel rate, no-doubt distance, park factors) and Baseball-Reference (HR/9) before betting anything.
The takeaway
The casual bettor sees a famous slugger and clicks Yes. The sharp bettor sees a matchup: this hitter’s measured power, against this pitcher’s batted-ball profile, in this park, with this platoon edge, in tonight’s weather.
The name on the back of the jersey is the least useful thing on the screen. The exit velocity, the barrel rate, the no-doubt distance, and the arm on the mound are the bet. Read those, and you’ll know whether Yes is a value or a vibe.
Player figures: Oneil Cruz ~96.0 mph average exit velocity and the 122.9 mph Statcast-era hardest-hit HR (May 2025); James Wood ~95.6–96.3 mph; Aaron Judge ~95.4 mph with ~24.7% barrel rate; Cruz ~17.9% barrel rate — all via Baseball Savant/Statcast 2025–2026. HR/9 marks (Webb ~0.63, Fried ~0.72, Valdez ~0.74, Snell ~0.86, Wheeler ~0.87) are active career leaders via Baseball-Reference. Park factors (Dodger ~129, Great American ~122, PNC ~66–78, T-Mobile/Globe Life ~91; 100 = average) via recent Statcast data. All figures are multi-game/multi-season averages that shift over time — verify current numbers before betting. Home run props are high-variance; this framework describes probabilities, not outcomes. Nothing here is betting advice.