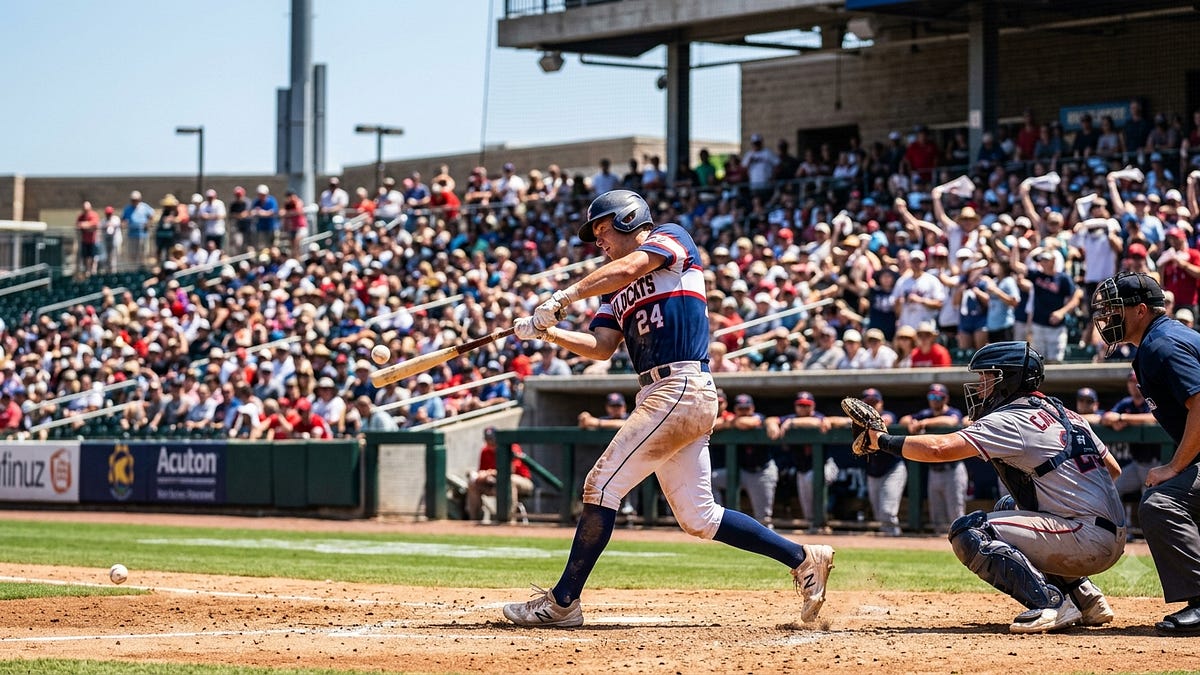
Pull up home run totals by month for almost any MLB season and you’ll see the same curve: a cold, low-output April, a steady climb, a peak in the heat of July and August, then a September fade. Hitters get credit for “heating up.” Pitchers get blamed for “wearing down.” Both are partly real. But a measurable slice of that summer surge has nothing to do with the players — it’s the air getting thinner, and you can calculate exactly how much it helps.
Let’s actually do the math. Not hand-wave at it — write down the equations the physicists use, plug in real numbers for a hot day versus a cold one, and see how many feet of carry the air is worth. Then we’ll get to the harder question: whether any of this is tradeable, or already baked into every line on the board.
Start with the force that matters: drag
A batted ball in flight feels three forces — gravity, the Magnus force (from spin), and drag (air resistance). For the question of how far a fly ball carries, drag is the one the weather controls. The standard equation, straight out of Alan Nathan’s baseball-physics work, is:
F_D = ½ · C_D · ρ · A · v²
Where:
-
F_D = drag force (the thing slowing the ball down)
-
C_D = drag coefficient (≈0.40 for a baseball at game speeds)
-
ρ = air density
-
A = cross-sectional area of the ball (≈0.00426 m²)
-
v = speed of the ball through the air
Look at what’s constant and what isn’t. The drag coefficient, the ball’s area — fixed. The ball’s speed off the bat is set by the hitter. The only term the atmosphere controls is ρ, the air density. Drag is directly proportional to it: cut air density by 10%, and you cut the drag force on the ball by 10% at every point in its flight. Less drag, more carry. Every weather effect on a fly ball runs through that single variable.
So the whole question — “why do more homers fly in July?” — reduces to: what makes ρ go down, and by how much?
The air-density equation
Air density isn’t a mystery either. Nathan gives a clean working expression for it as a function of temperature and elevation:
ρ = ρ₀ · (T₀ / T) · exp(−z / 26,250)
Where:
-
ρ₀ = sea-level reference density = 1.225 kg/m³ (0.0767 lb/ft³) at 59°F
-
T = absolute temperature in Kelvin
-
T₀ = reference temperature (288.16 K, i.e. 59°F)
-
z = elevation in feet
Two levers jump out: temperature (in the T term) and elevation (in the exponential). Warmer air → higher T → lower ρ. Higher elevation → bigger negative exponent → lower ρ. Both thin the air; both add carry. Let’s quantify each.
Temperature: run the numbers
Take two real, documented game-day conditions from Nathan’s own examples:
-
A cold night at AT&T Park (San Francisco): 48°F, near sea level → air density ≈ 0.077 lb/ft³
-
A hot day at Coors Field: 95°F, 5,184 ft elevation → air density ≈ 0.058 lb/ft³
That’s a density drop of about 25% — though most of that gap is Denver’s altitude, not temperature. To isolate temperature alone, hold elevation fixed and just move the thermometer: going from a 50°F April night to an 85°F July afternoon at the same sea-level park drops air density by roughly 6–7%, because density scales with the inverse of absolute temperature (and a 35°F swing is a meaningful fraction of the ~510°R absolute baseline).
Feed that ~6–7% drag reduction through a full trajectory simulation and you get the number Nathan is famous for:
A fly ball carries about 3 feet farther for every 10°F increase in temperature.
Equivalently, home run rate rises ~2% for every 1°C of warming. So that 35°F April-to-July swing is worth roughly 10 extra feet of carry on a well-struck ball — before the hitter does anything different. Stack a summer’s worth of warm games on top of each other and you’ve mathematically accounted for a real chunk of the July spike.
Why does 3 feet matter so much? Because home runs cluster at the margin. A huge share of them clear the fence by single-digit feet, and a huge share of long outs are fly balls that died just short. Shift the entire distribution 10 feet deeper and you convert a meaningful tail of warning-track outs into souvenirs.
Altitude and pressure: the same term, amplified
The exponential elevation term is why Coors Field is a punchline. Plug Denver’s 5,184 feet into exp(−z/26,250) and you get air density at roughly 82% of sea level — a permanent ~18% drag reduction that no amount of weather at sea level can match. The documented result: a ball that carries 400 feet at sea-level Yankee Stadium travels about 440 feet in Denver. Statcast carry data backs it out empirically at about 7.5% more carry than league average at Coors — roughly 30 extra feet on a home-run-distance ball.
Barometric pressure works the same way at a single park — it’s baked into ρ through the full ideal-gas relationship ρ = P/(R·T). Lower pressure (the low-pressure systems that often accompany summer heat) means lower density. The rule of thumb: about 2 feet of extra carry per 0.3 inHg drop in pressure.
Humidity: the term everyone signs wrong
Now the counterintuitive one, and the math explains why everyone’s gut is wrong. Humid air feels heavy, so people assume it kills the ball. But run the molecular weights: dry air is mostly N₂ (28 g/mol) and O₂ (32 g/mol), while water vapor (H₂O) is only 18 g/mol. By the ideal gas law, swapping heavier molecules for lighter water vapor at the same temperature and pressure lowers density. So humid air is slightly thinner, and the ball carries marginally farther — the opposite of the folk belief.
But the magnitude is tiny: about 1–2 feet going from dry (~30% RH) to humid (~80% RH). Humidity’s larger role is on the ball in storage (the Coors humidor changes the ball’s mass and restitution, not the air), so for a single game, the right coefficient on humidity is “almost zero.” Don’t let a muggy forecast move your number much in either direction.
Wind: the term that swamps the others
Everything above moves ρ by single-digit percentages. Wind acts on a different term entirely — it changes v, the ball’s speed relative to the air, in the drag equation. And because drag goes as v², small changes in relative wind speed have outsized effects on the trajectory.
Nathan’s estimate: a 5 mph wind blowing straight out adds roughly 18–20 feet of carry. Five mph is barely a flag-flutter. A real outward wind at a park like Wrigley can add far more and turn it into a bandbox; the same wind blowing in can erase 20+ feet and smother scoring. Of every variable here, wind is the largest single-game swing — and, importantly for the market question, it’s the one the books watch most aggressively.
Putting the coefficients together
Summarize the whole model as a rough sensitivity table — how many feet of fly-ball carry you gain (or lose) per unit of each variable:
-
Temperature: ≈ +3 ft per +10°F
-
Altitude: ≈ +40 ft at Denver vs. sea level (~7.5% carry)
-
Pressure: ≈ +2 ft per −0.3 inHg
-
Humidity: ≈ +1–2 ft across the full dry-to-humid range (negligible)
-
Wind: ≈ +18–20 ft per +5 mph blowing out (dominant)
A hot, low-pressure, breezy-out July afternoon stacks the first, third, and fifth lines in the hitter’s favor — and the calendar delivers those conditions in clusters every summer. That’s the surge, quantified.
Now the market question — and the honest answer
Here’s where a betting newsletter has to be disciplined, because this is exactly the kind of math that seduces people into overconfidence.
The physics above is settled and reliable — those coefficients are measured facts. But the question that actually matters for trading is: how much of this does the market already know? And the answer is, mostly, all of it.
The seasonal pattern is fully priced. “It’s July, take the over” is not an edge; every line already reflects that summer scores more. The obvious daily weather is priced too — a 20 mph wind howling out at Wrigley is in the total before you finish reading the forecast. The visible, forecastable inputs to ρ and v are baked in.
The only theoretically open gap is the difference between the forecast the line was set on and the actual conditions during the game — temperature sliding as the sun sets, a pressure system arriving between innings, wind shifting from the projection. A pre-game total is priced on expected conditions; reality can drift from them.
Why the edge is a hypothesis, not a system
I’ll be blunt, because your trust matters more than a good story: the physics is a fact and the trading edge is unproven.
-
The books aren’t asleep. They run in-game models and employ sharp people. Any weather edge simple enough to write down is one they’re likely already pricing.
-
Single games are pure variance. Even a perfectly correct read on ρ shifts a home run’s probability by a sliver. It only matters across a large sample.
-
The “window” is unknown. It’s tempting to claim there’s a tidy lag between when conditions change and when the line moves. I have no verified measurement of such a window, or proof it survives on liquid markets. Distrust anyone who quotes you a confident number — including me, if I did.
Where it actually connects to what we do
If a usable version of this exists, it lives where this newsletter always lands: slow markets. A sharp book reprices a total fast; a thinly traded prediction-market contract on the same game can lag. That lag — not the atmospheric model — is the real opportunity, and it’s the same convergence trade we keep coming back to. You don’t need to solve the air-density equation in real time to profit; you need to spot two markets disagreeing and bet the gap closes. The physics is a candidate reason a gap might open. The convergence is the part that pays.
The takeaway
More home runs fly in July partly because hitters are locked in — and partly because, every summer, the drag equation quietly tilts in the hitter’s favor. Thinner warm air means a smaller ρ, a smaller drag force, and about 3 feet of extra carry per 10°F, amplified by altitude, nudged by pressure, barely touched by humidity, and occasionally blown wide open by wind. That math is exact, and it’s worth understanding whether or not you ever place a bet.
Turning it into an edge is a separate, much harder, and unproven claim. The drag coefficient is a fact. The profit is a hypothesis. Keep those straight and you’re already sharper than everyone who reads the same equations and convinces themselves they’ve found a money machine.
Equations and figures from Dr. Alan Nathan’s baseball-physics work (University of Illinois): drag force F_D = ½C_D·ρ·A·v² with C_D ≈ 0.40, A ≈ 0.00426 m²; air density ρ = ρ₀(T₀/T)·exp(−z/26,250) with ρ₀ = 1.225 kg/m³ (0.0767 lb/ft³) at 59°F; worked density values (~0.077 lb/ft³ at 48°F sea level; ~0.058 lb/ft³ at 95°F/5,184 ft Coors) from Nathan’s drag-coefficient paper. Carry figures: ~3 ft per 10°F, ~2% HR per 1°C, ~400→440 ft sea-level-to-Denver, ~7.5% Coors carry, ~2 ft per 0.3 inHg, ~1–2 ft humidity range, ~18–20 ft per 5 mph outward wind — all from Nathan and related published modeling. The market-inefficiency and “window” discussion is an explicitly unverified hypothesis, not a measured system. Convergence references describe a general strategy, not a guarantee. Nothing here is betting advice.