In the last piece, we worked out how a right-handed slugger’s home run probability climbs against a left-handed pitcher. To do it, we kept moving between two different numbers: the chance he homers in a single at-bat, and the chance he homers at some point in the game. Those are not the same number, and the way you convert between them trips up almost everyone who bets home run props.
The instinct is to divide. If a hitter has a 20% chance to go deep in a game and he bats four times, surely each at-bat is 20% ÷ 4 = 5%? It’s clean, it’s intuitive, and it’s wrong. Here’s why — and why getting it right is worth real money on a low-priced contract.
The trap: home runs can stack
The reason you can’t divide is simple once you see it: a hitter can homer more than once in a game. When you split 20% evenly into four 5% at-bats, you’re quietly assuming the only thing that can happen is zero or one home run. But two-homer games exist. Three-homer games exist. Simple division double-counts those overlapping outcomes and gives you the wrong per-at-bat number.
The math has to account for every way “at least one home run” can happen — one homer, two, three, four — not just the first one. The clean way to do that is to flip the question around and ask about the one outcome that doesn’t overlap with anything: hitting zero.
The right formula: work through “zero”
Instead of computing the chance he homers, compute the chance he doesn’t — across every at-bat — and subtract from one.
If p is the probability of a home run in a single plate appearance, then:
-
The chance he does not homer in one PA is (1 − p)
-
The chance he does not homer in any of his PAs is (1 − p) multiplied by itself once per PA
-
So for n plate appearances: P(no HR all game) = (1 − p)ⁿ
-
And therefore: P(at least one HR) = 1 − (1 − p)ⁿ
That’s the whole tool. One line. Let’s run it both directions, because in betting you need to go both ways.
Direction 1: from per-at-bat to per-game
Say a hitter truly has a 5% home run rate per plate appearance and bats 4 times. What’s his chance to homer in the game?
-
P(no HR all game) = (1 − 0.05)⁴ = 0.95⁴ = 0.8145
-
P(at least one HR) = 1 − 0.8145 = 0.1855
So 5% per at-bat works out to 18.5% per game — not 20%. If you’d taken 5% × 4 = 20%, you’d have overstated his game probability by a point and a half.
Direction 2: from per-game back to per-at-bat
Now the reverse, which is the one that catches people. A market (or your model) says the hitter has a 20% chance to homer in the game, and he bats 4 times. What’s the implied per-at-bat rate?
-
(1 − p)⁴ = 1 − 0.20 = 0.80
-
(1 − p) = 0.80^(1/4) = the fourth root of 0.80 = 0.9457
-
p = 1 − 0.9457 = 0.0543
So a 20% game probability implies about 5.4% per at-bat — not 5%. Naive division undershoots the true per-PA rate, because it ignored those stacked multi-homer games.
Seeing the gap in a table
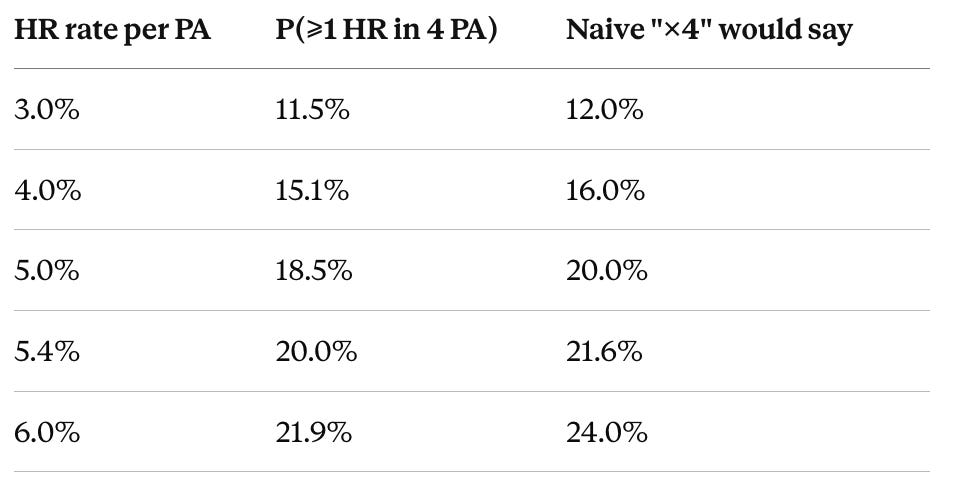
Here’s the relationship laid out for a hitter batting 4 times, so you can feel how per-PA rate maps to game probability:
Two things jump out. First, the naive “multiply by four” column is always too high, and the gap widens as the rate climbs — because the more likely a homer is per at-bat, the more multi-homer games you’re double-counting. Second, the errors are in the 1-to-2 percentage point range. On a coin-flip market that’s noise. On a home run prop priced at 15-20¢, one to two points is a 5 to 13 percent relative mispricing — the exact size of edge worth hunting.
Why this matters for the price
Home run props live in the cheap part of the board — Yes contracts priced anywhere from a nickel to a quarter. That’s precisely where small absolute errors become large relative ones.
Suppose your platoon-and-park analysis says a slugger genuinely has a 5.4%-per-PA home run rate tonight. The correct game number is 20%, which is a fair price of about 20¢ on a Yes contract. But imagine the line was built by someone who reasoned “he’s a 5%-per-PA guy, times four at-bats, call it 20%” — they landed near the right answer by luck, because two errors partially cancel. Now imagine instead they started from a per-game model that under-weighted his at-bats, or anchored on his blended season rate. The price drifts to 17¢. Your correct 20¢ versus their 17¢ is a 3-cent edge — and you only see it because you did the (1 − p)ⁿ math instead of eyeballing it.
The point isn’t that everyone divides wrong every time. It’s that the conversion between per-at-bat and per-game is where home run props get subtly mispriced, and if your math is exact while the market’s is approximate, the gap is yours.
The number of at-bats matters too
One more variable people skip: n isn’t always 4. Where a hitter bats in the order changes his plate appearances, which changes the game probability for the same per-PA rate:
-
A leadoff hitter might get 4.5+ PA — more bites at the apple, higher game HR probability.
-
A bottom-of-the-order hitter might get 3.7–4.0 PA — fewer chances, lower probability.
Take our 5.4%-per-PA hitter. At 4 PA he’s a 20.0% game shot. Bat him leadoff for 4.6 PA and it’s 1 − (0.946)^4.6 ≈ 22.5%. Drop him to the bottom for 3.7 PA and it’s ≈ 18.6%. Same hitter, same swing, a near 4-point swing in game probability purely from lineup position. A market pricing him on a generic “4 at-bats” assumption misses that — and a hitter moving up in the order on a given night is a small, real, often-unpriced edge.
The honest caveats
This assumes each PA is independent. The (1 − p)ⁿ formula treats every at-bat as a fresh, identical coin flip. Reality is messier — he might face a tough lefty reliever in the 8th, or the pitcher he crushed in PA one gets pulled. Independence is a clean approximation, not gospel; use it as a strong baseline, not a law.
p itself is the hard part. The conversion math is easy and exact. Estimating the true per-PA home run rate — accounting for the pitcher, park, weather, and platoon edge from the last piece — is the genuinely difficult work, and it’s where most of your effort should go. Perfect conversion math on a garbage input still gives you garbage.
Single games are variance. A 20% game probability means he doesn’t homer 80% of the time. This math sharpens your estimate of the probability; it tells you nothing about tonight’s actual result. The edge only exists across many correctly-priced bets.
The takeaway
A hitter’s per-at-bat home run rate and his per-game home run probability are linked by one formula — P(at least one) = 1 − (1 − p)ⁿ — and not by division. Multiplying the per-PA rate by the number of at-bats always overstates the game number, because it double-counts the multi-homer games that division pretends can’t happen.
The errors are small in absolute terms and large in relative terms on cheap home run contracts, which is exactly where they’re worth catching. Get the conversion exact, do the hard work of estimating the per-at-bat rate honestly, and account for how many times the guy actually bats — and you’ll be reading a sharper number than the market that just multiplied by four.
The math is the easy part. Most people just skip it.
The conversion P(≥1 HR) = 1 − (1 − p)ⁿ assumes independent, identically distributed plate appearances — a standard and useful approximation, not an exact model of in-game reality (relief matchups, pitcher changes, and situational effects all violate strict independence). Worked examples (5% per PA → 18.5% per game; 20% per game → 5.4% per PA; lineup-position swings) are illustrative. Plate-appearance-per-game figures by lineup spot are approximate league norms. Odds/price conversions are fair-odds (no-vig) approximations. Single-game outcomes are high-variance; this math estimates probabilities, not results. Nothing here is betting advice.