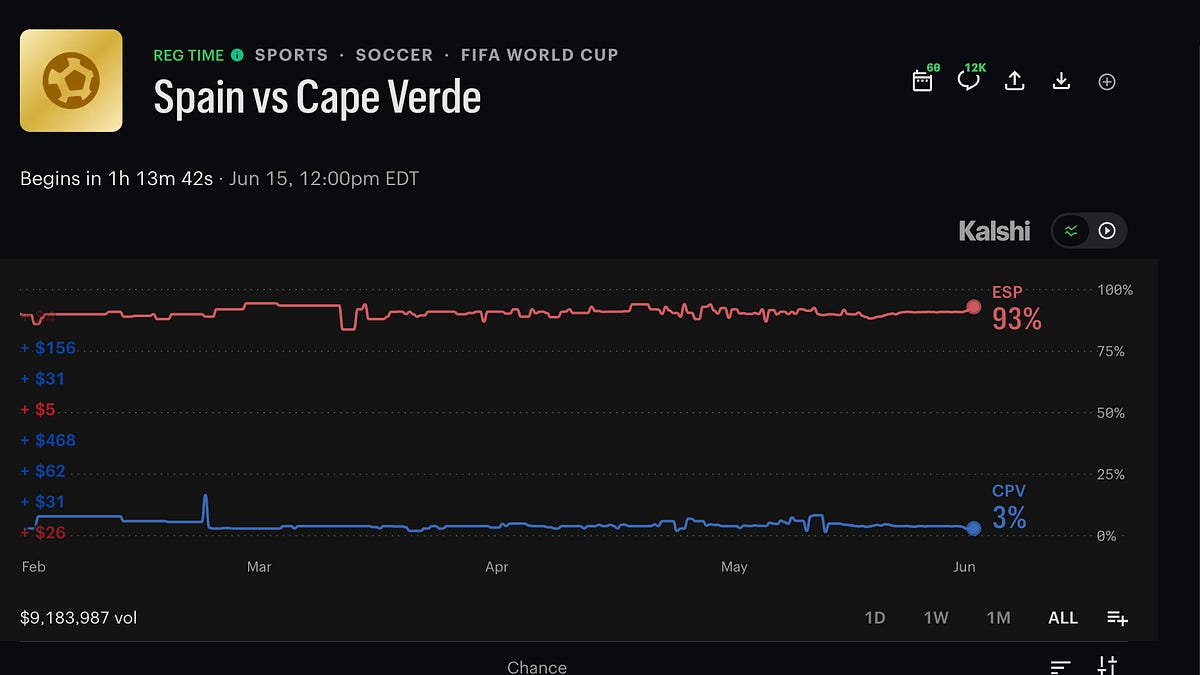
There’s a small thing on the Kalshi price chart that I can’t stop looking at.
Pull up a busy market — Spain vs Cape Verde, a World Cup group game showing $9.18 million in volume more than an hour before kickoff — and watch the left edge of the chart. Little dollar figures float up the side. +$156. +$31. +$5. +$468. +$62. +$26. Red ones, blue ones. They appear, they climb, they scroll. Money, apparently, moving in real time.
It looks like proof the market is alive. And maybe it is. But the more I look at it, the more I have questions I can’t fully answer — and the fact that I can’t answer them is, itself, the point.
I’m not going to tell you Kalshi is doing anything wrong. I genuinely don’t know that, and I’m not going to pretend I do. What I can do is lay out what I can verify, what I can’t, and let you sit with the gap. Because the gap is bigger than it should be.
Question 1: Are those even completed trades?
Here’s the first thing that should bother you. Kalshi’s own help center describes two completely different things that both involve dollar amounts and prices:
There’s the order book — which Kalshi defines as “all the resting orders available on the market,” where a resting order is “an offer to purchase contracts at a certain price that is not matched immediately.” Offers. Intentions. Orders that can sit there, and then get cancelled, having never cost anyone a cent.
And there’s actual trade history — completed transactions where money changed hands.
These are not the same. One is what people say they’ll do. The other is what they did. So when those numbers float up the side of the chart, which one am I watching? Executed trades? Resting offers? Some blend of both?
I’ve read Kalshi’s documentation on their price graph, their forecast graph, their “live data graphs,” and their order book. None of them clearly explains what those specific floating figures represent. For a regulated financial exchange, that’s a strange thing to leave undefined. If they’re completed trades, fine. If they’re resting orders dressed up to look like completed trades, that’s a very different picture — because resting orders can be placed and pulled, and a screen full of them would make a market look far more active than it actually is.
I’m not saying that’s what’s happening. I’m saying I can’t rule it out from what Kalshi tells me, and neither can you.
Question 2: Is one number one person?
Say they are completed trades. Next question: does +$468 mean one person bought $468 worth? Or is it several smaller orders the system bundled into a single tidy print?
This isn’t a paranoid question — it’s a real feature of how matching engines work. When you place a market order for a large position, it fills against multiple resting orders at once. One buyer can generate several fills. Several buyers can be netted into one display tick. The matching engine makes these choices, and then a display layer on top makes its own choices about how to show them to you.
So a single floating +$468 could be:
-
One person making one $468 trade, or
-
One person’s order filling against six others, shown as one number, or
-
Several unrelated trades in the same instant, grouped for a cleaner-looking feed.
Each of those tells a wildly different story about how much real, independent conviction is in the market. And Kalshi doesn’t tell you which one you’re looking at. The grouping logic — whatever it is — is a choice. Choices made about how to display money are never neutral. They’re made by someone, for a reason, and “make the market feel busier” is a reason that benefits the house.
Question 3: What does “$9.18 million volume” actually mean?
This one I can answer, and the answer is the most revealing part of the whole exercise.
That $9.18 million figure is not $9.18 million of money. It’s “notional volume,” and here’s how Kalshi counts it, per their own methodology: they multiply the number of contracts by the $1 face value — not the price actually paid — and they count both sides of every transaction separately.
Run that through an example. A contract bought and sold at 10¢ generates $2.00 of “volume” against 10¢ of actual money that changed hands. The accounting inflates the headline by 20x on a longshot.
And it gets more extreme the further from 50¢ the price sits. On a 93¢/3¢ blowout like Spain vs Cape Verde, the gap between the scary-big “volume” number and the actual dollars at risk is enormous. The number is real — it’s calculated by a consistent rule — but it means something very different from what a normal person assumes when they see “$9 million traded.”
Nobody is lying. But nobody is volunteering that the headline number is a face-value, double-counted figure, either. It just sits there at the bottom of the chart, big and impressive, doing exactly what a big impressive number does to a person deciding whether to join in.
Question 4: Is any of this even happening now?
Even the timing is softer than it looks. Kalshi’s own “Live Data Graphs” help page admits, in writing, that there can be “a potential delay between the information presented in the graphs” and the actual confirmed state of the market, and advises traders to “use live data graphs as a guide but not rely on it solely.”
That’s the exchange telling you, quietly, in a help doc nobody reads: don’t fully trust the timing of what you’re watching. The feed that feels like a live wire of this-second activity is, by their own admission, something to take with a grain of salt.
So what’s actually going on here?
Let me be clear about what I’m not claiming. I’m not claiming Kalshi fabricates trades — and honestly, the presence of tiny $5 and $26 prints argues against fabrication, because nobody fakes hype with five-dollar numbers. I’m not claiming any law is being broken. I have no evidence of that and I won’t pretend otherwise.
What I’m claiming is narrower and, I think, harder to argue with: every ambiguity in that interface happens to break in the same direction.
-
The floating numbers aren’t clearly defined — and the undefined version makes the market look more active.
-
The grouping of trades isn’t disclosed — and the ambiguity makes individual conviction look larger.
-
The volume number is face-value and double-counted — and that makes it look many times bigger than the real money.
-
The feed has an admitted delay — and the delay is invisible while the urgency it creates is not.
Any one of these, alone, is a defensible design decision. All of them, pointing the same way — toward “the market looks bigger, busier, faster, and more urgent than the underlying reality” — is a pattern. And patterns are worth noticing, even when you can’t prove intent.
A casino doesn’t have to rig the slot machine to tilt the floor in its favor. It just has to design every ambiguous detail — the lights, the sounds, the free drinks, the absence of clocks — to point the same way. The payouts can be perfectly honest and the room can still be built to make you play longer than you meant to.
I’m not saying Kalshi’s floor is tilted. I’m saying I’ve got a screen full of numbers I can’t fully explain, four separate places where the ambiguity favors the house, and an exchange that hasn’t gone out of its way to clear any of it up.
Maybe that’s nothing. Maybe it’s all innocent UX and I’m reading tea leaves.
But you’re about to put real money — actual dollars, not face-value notional double-counted dollars — into that screen. And before you do, it’s worth asking the question the interface seems designed not to provoke:
What, exactly, am I looking at?
What’s verifiable here: Kalshi’s own docs define resting orders vs. trades (help.kalshi.com order book article), admit a display delay on live graphs (live data graphs article), and the face-value, both-sides volume methodology is confirmed by DeFiRate’s tracking page. What’s NOT established: exactly what the floating chart figures represent, and how (or whether) trades are grouped for display — Kalshi does not document this, which is the basis for the questions raised above. This piece raises questions; it does not assert manipulation, fabrication, or any violation. Verify everything against the live app and Kalshi’s own materials before drawing conclusions.