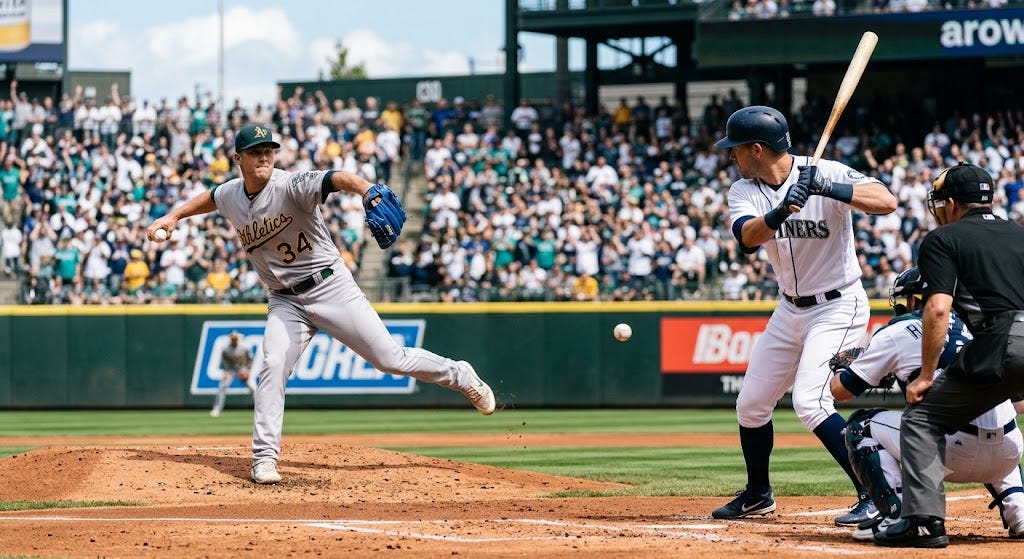
“Righties hit lefties better” is one of the oldest pieces of baseball conventional wisdom, understood by managers since before there was a single statistic to prove it. It’s true. But “true” isn’t tradeable. How much better is the question that matters — and more specifically, how much better at the one outcome a home run prop cares about: power.
Because here’s the thing the casual bettor misses. The platoon advantage isn’t uniform across all stats. It’s smallest for batting average and largest for slugging — for the extra-base power that turns into home runs. When a right-handed slugger steps in against a left-handed pitcher, the part of his game that benefits most is exactly the part you’re betting on in a “will he go deep?” market. Let’s quantify it.
The baseline numbers
The most rigorous public work on platoon splits — from The Book and replicated by Baseball Prospectus across hundreds of players — gives clean average figures for what a right-handed batter gains facing a lefty instead of a righty:
-
Batting average: +17 points (e.g. .259 → .276)
-
On-base percentage: +19 points (.316 → .336)
-
Slugging percentage: +33 points (.393 → .431)
Look at the shape of that. The slugging gain (+33) is nearly double the average gain (+17). The platoon advantage is disproportionately a power advantage. In wOBA terms — the stat that best captures total offensive value — the right-handed batter’s platoon edge is about 16 points, and the slugging component is doing most of the heavy lifting.
(For contrast: left-handed batters get an even bigger platoon boost facing righties — roughly +24/+26/+56 and ~28 points of wOBA — because lefties see far fewer same-handed pitchers and the unfamiliarity compounds. But our subject here is the righty-vs-lefty matchup, so we’ll stick with the +17/+19/+33 line.)
Why the edge is biggest for power
The mechanism explains the math. The platoon advantage exists mostly because of breaking-ball movement. A left-handed pitcher’s slider, sweeper, and sinker break away from a left-handed batter — and toward a right-handed batter. A pitch breaking toward you, into the heart of the plate and onto the barrel, is a pitch you can drive. A pitch breaking away, off the end of the bat, is one you can only slap.
That’s why the gain shows up in slugging more than average. It’s not just that the righty makes more contact against the lefty — it’s that he makes better contact, on the inner half, with the barrel, at the launch angles that produce extra-base hits and home runs. The platoon edge is, at its core, a quality-of-contact edge, and quality of contact is the entire input to a home run.
This also makes the split unusually stable. Because it’s driven by physics — pitch trajectory relative to the bat — rather than by a hot streak, the platoon advantage holds up even in small samples. It’s the single most reliable split in baseball, which is exactly what you want underpinning a bet.
Turning the split into a home run probability
Here’s where it gets useful for a prop. Slugging gain is nice, but a home run market wants a home run probability, so let’s convert.
A right-handed power hitter might have a baseline home run rate of, say, 4% per plate appearance against right-handed pitching (roughly one homer every 25 PA — strong-slugger territory). The platoon power boost doesn’t just nudge his slugging; it lifts the home-run slice of that slugging specifically. Research on handedness splits suggests the HR-rate increase from the platoon advantage runs in the neighborhood of 15–25% in relative terms for a typical power hitter facing the opposite hand.
Apply the middle of that range — call it +20% relative — to our 4% hitter:
-
vs. RHP: 4.0% HR per PA
-
vs. LHP: 4.0% × 1.20 = 4.8% HR per PA
That’s an 0.8-percentage-point absolute bump. Over a four-PA game, the math compounds into the daily “will he homer?” number:
-
P(no HR in 4 PA) vs. RHP = (1 − 0.040)⁴ = 0.849 → so P(at least one HR) ≈ 15.1%
-
P(no HR in 4 PA) vs. LHP = (1 − 0.048)⁴ = 0.821 → so P(at least one HR) ≈ 17.9%
So purely from the platoon matchup, our slugger’s single-game home run probability climbs from roughly 15.1% to 17.9% — nearly three full percentage points — just by swapping a right-handed starter for a left-handed one. Nothing about the hitter changed. Only the arm he’s facing did.
What that does to the odds
Now translate the probability into prices, because that’s where the bet lives.
A 15.1% chance, expressed as fair odds, is about +562 (American) or 6.62 in decimal. A 17.9% chance is about +459 / 5.59 decimal. On a prediction market that prices in cents, that’s a move from roughly a 15¢ “Yes” to an 18¢ “Yes.”
Three cents may not sound like much, but consider what it means in practice:
-
If a market is pricing the hitter’s home run Yes at 15¢ because the line was set without fully weighting the lefty on the mound, and your platoon math says the true number is closer to 18¢, that’s a 3-cent edge on a low-priced contract — a 20% relative mispricing.
-
The effect stacks with everything else. Put that righty slugger in a launching-pad park, on a hot day, with the platoon edge, and the individual boosts compound. The platoon piece alone is ~3 points; combine it with a favorable park and weather and the true probability can diverge materially from a price anchored on the hitter’s overall season rate.
This is the core inefficiency: betting lines and props are often set off a hitter’s overall numbers, not his platoon-specific numbers. A .280 hitter who hits .320 against lefties is priced like a .280 hitter even when a lefty is starting. The same logic applies, even more sharply, to power: a slugger whose HR rate jumps 20% against lefties is often priced on his blended rate. The gap between the blended price and the matchup-specific reality is the edge.
The honest caveats
These are averages, not laws. +17/+19/+33 is the league-wide mean platoon split. Individual hitters vary enormously — some right-handed batters have huge platoon splits, others have almost none, and a handful have reverse splits (they hit same-handed pitching better). Always pull the specific hitter’s actual vs.-LHP numbers rather than applying the league average blindly. The 4%-baseline example above is illustrative; plug in the real hitter’s real rates.
The starter isn’t the whole game. A righty might start against the lefty and get the platoon edge for two at-bats — then the opposing manager brings in a right-handed reliever and the edge evaporates for the rest of the night. “Realized” platoon advantage is always less than the on-paper version, because bullpens exist specifically to erase it.
The market often already knows. Sharp books and traders price handedness. The edge isn’t “platoon splits exist” — everyone knows that. The edge is in the specific spot where a price was anchored on blended numbers and hasn’t fully adjusted for the matchup, the park, and the weather all pointing the same way. That’s a narrower and less frequent opportunity than the raw math implies.
Single games are variance. A 17.9% home run probability still means he doesn’t homer 82% of the time. The platoon math improves your read on the probability; it does nothing to guarantee the outcome of one game. The edge only exists across a large sample of correctly-priced bets.
The takeaway
The platoon advantage is real, it’s stable, and — crucially for home run markets — it’s biggest exactly where you’re betting: power. For a right-handed slugger facing a lefty, the league-average math runs about +17 AVG / +19 OBP / +33 SLG, which translates to roughly a 15–25% relative bump in home run rate and, for a typical power hitter, a single-game home run probability climbing something like 15% to 18% — a three-cent move on a Yes contract.
The number isn’t enormous. But it’s real, it’s quantifiable, and it most often goes unpriced when a line is anchored on a hitter’s overall season stats. Find the righty masher facing a lefty in a hitter’s park that the market is still pricing like an average matchup, and you’ve found the gap. The handedness is the edge. The math just tells you how big.
Platoon-split figures (RHB vs. LHP: +17 AVG / +19 OBP / +33 SLG; ~16 points wOBA; LHB larger at +24/+26/+56 and ~28 wOBA) are league-average values from The Book and Baseball Prospectus/FanGraphs replications. The ~15–25% relative HR-rate bump and the 4%-baseline, 4-PA worked example are illustrative applications of those splits to a home run probability, not a measured rate for any specific player — always use the individual hitter’s actual vs.-LHP numbers. Odds conversions are fair-odds (no-vig) approximations. Platoon splits are averages with large individual variation, including reverse splits; realized in-game advantage is reduced by relief-pitcher matchups. Single-game outcomes are high-variance. Verify current splits at Baseball Savant/Baseball-Reference before betting. Nothing here is betting advice.